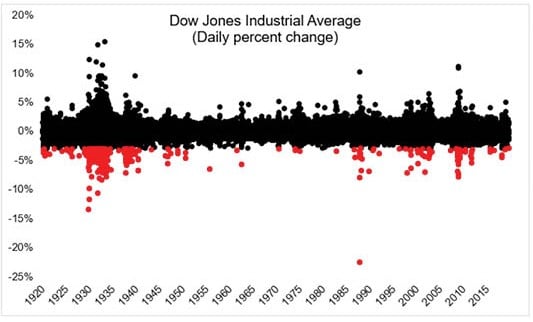
This week marked the 307th time that the Dow Jones index fell 3% or more in a single day when reviewing historical market data. The chart above displays the Dow Jones Industrial Average going back to 1920, and the daily percentage change in each of those years. You’ll see many red dots on the chart indicating these pullbacks, yet the black dots of positive returns highly outweigh the red.
Essentially, these pullbacks are normal, we’ll have many throughout a year, as well as corrections, and at times a recession will happen as part of the business cycle. These daily and weekly pullbacks (downturns of -1% to -9.9%) do not necessarily mean it is time to make sweeping changes.
We are monitoring these adjustments in our global markets. The price for higher returns than cash is volatility in the stock market for long term investors. Overall, our economy is stable, unemployment is at historic lows, retail sales are strong, and inflation is low. Most importantly, your financial plan will keep you on track.
This week in review covers one of 52 weeks this year, and one of 1,560 weeks over the next 30 years. Keep perspective, and let’s review your plan if you’re looking for additional peace of mind.
Have a good weekend.
